Monday, July 13, 2009

Nice rally back up to test Head-and-Shoulders Top Neckline.

Today's SPX rally is a textbook retest of the Head-and-Shoulders Top (HST) Neckline (NL). The minimum objective of the HST is down to around 825 (HST-OBJ). We also have a downtrend line (R1) appearing to form.
---
Patterns in the indexes are often not perfect and as I've always said 75% accurate at best. If we assume that this pattern is going to be accurate (which I believe it will be), we could possibly drop obviously tomorrow after the NL retest and move quickly down to 825. Another possibility is the imperfection scenario whereby the SPX moves higher to R1 and is not properly resisted by NL. Also, the SPX could move sideways for a while and eventually tag R1 while still not closing above NL. There's really no way to know which of these cases will unfold. But I do think the next significant move will eventually be down to at least 825 where I'll be looking at re-entering long with accounts not managed by mechanical methods.
---
Another interesting point is that around holidays the financial data is usually filled with errors for some reason. In the chart above there is no downside opening gap visible on the 7/2/09 open (gap?). But in the intraday chart it's clearly there at 922 to 924. I believe it does exist and so it remains an unfilled overhead gap.
---
Bottom line is I'll be expecting the drop to 825 and as we get close, I'll develop a buying strategy.

Tuesday, July 7, 2009

Will most likely exit today.

I will be using the same exit rule today as I posted yesterday. As of now (1:30p Mountain), that would cause me to exit to 100% cash with all accounts not managed by mechanical methods.

Monday, July 6, 2009

Testing Head-and-Shoulders Top (HST) neckline.

The SPX is trying to confirm a rather large Head-and-Shoulders Top (HST) by closing below the neckline (NL). If the HST is confirmed I'll expect a drop to at least 825 (HST-OBJ) which isn't something that I'm willing to ride out. Therefore today, if the SPX is at or below 887 (which is today's early low) at my fund cutoff time (~10 min before the close), I'll exit to 100% cash with my accounts not managed by mechanical methods.

I do have quite a bit of hope for a reversal today back above NL and thus no confirmed HST. We have two unfilled gaps overhead (G1, G2) which should tend to resist further downside. We had a late-day sell off before the holiday that took out extremely minor support at the level of the expected downside objective from the 7/2/09 open which gapped down and out of an uptrending channel. (Channel break downside objective = CH-OBJ). Then we opened gap down this morning.

---

Right now (11:45am Mountain), the SPX is trying to move higher to fill the gap G1. If this happens too early in the day (like now), we could get some selling which would move the SPX down to lows at the close. The action near the close today is going to be very interesting. If buying can come in late to close G1 and the day closes up to near today's highs, I'll expect more upside to fill G2 at over 920.

---

On the other hand, if we close down near today's low, I think the HST will be considered confirmed and we should move lower to at least 825 eventually. I won't necessarily expect the drop to occur immediately and there may be another move back up to NL which will be an obvious exit point if we miss this one.

Wednesday, June 10, 2009

SPX consolidation

As I said last time I expected the SPX to move sideways for about a month and we're now eight days into it. The gap (G1) still has not yet filled and it probably will. ST-S1 is roughly the confirmed Head-and-shoulders Neckline (NL2) which has now been tested approximately three times. My current plans are to just sit tight hoping to sell at SPX 1000 or higher but that could change if we are near ST-R1 (950) at a market close I might be tempted to exit and buy back in on any lower close inside this little trading range.

Monday, June 1, 2009

Another Head-and-Shoulders Bottom (HSB) Confirmed.

The SPX has broken out above NL2 confirming another HSB. The upside implications of HSB1 and HSB2 are 1075 and 1200, and are indicated on the chart above.
---
Today opened with an upside gap. This should tend to pull the SPX back down to retest NL2 and attempt to fill the gap. Since we have two more days of the early June seasonally bullish bias, I'm still hoping this rally has the legs to reach near 1000 (NL3?) quickly. If it happens in the next few days, I will take profits hoping to reenter at the NL2 retest, which I believe will remain likely until NL3? is overcome to the upside.
---
I expect NL3? to provide significant resistance to the SPX. I expect the SPX to consolidate between NL3? and NL2 for a month or so just like what occurred in May between NL2 and NL1. The resistance at 1000 (NL3?) may become such an obvious place to exit that NL3? ends up sloping downward just as NL2 did.
---
I'm not sure about my exact sell strategy at this point but I'll keep you posted.

Tuesday, May 26, 2009

Good rally without an opening gap.

The SPX has rallied well today off NL for the second retest of the Head-and-Shoulders Bottom (HSB) Neckline.
---
It appears that there are a lot of sellers at the 920-930 level which has produced a downsloping line R2. That line in conjunction with S2 (which is just an extension of NL), is producing a flat bottomed triangle. When these triangles form, the slightly most likely break is through the horizontal boundary which in this case would be down. If that were to occur I'd expect a drop of the width of the triangle which takes the SPX down to just under 850 (T-OBJ). In making that drop, S1 is also taken out. This would imply a drop of the R1/S1 channel width down to about 800 (C-OBJ). I'm not too interested in riding out that drop. If that drop were to occur, I'd consider it part of symmetry replicating the p750 low but reduced in both time and amplitude, which is very common in symmetrical moves.
---
The good news is that at tomorrow's close starts a historically bullish seasonal period (detailed below). That leads me to believe the break out of the triangle should be up with seasonals overruling a slight tendency to break though horizontal boundaries as opposed to sloping boundaries.
End of May/Early June
Historically, if one had been long the SPX on the last two trading days of May and first three trading days of June, they'd have returned:
---
1942-Present Winners: 64% Annualized Return: +40%
---
1990-Present Winners: 58% Annualized Return: +42%
---
2000-Present Winners: 56% Annualized Return: +56%
---
Therefore, I plan to just ride out these five days hoping for an upside break out of the triangle confirming another HSB with neckline NL2? I wouldn't be surprised to see the SPX test NL1? before the Wednesday June 3rd close on which the seasonally bullish period ends. If that occurs I'll probably take profits as I expect SPX 1000 to offer stiff resistance.

Wednesday, May 20, 2009

I'll give this position some room.

I've entered 100% long with account not managed by mechanical methods near the low on the retest of the Head-and-Shoulders Bottom (HSB) neckline (NL). This HSB implies an eventual move to around SPX 1100 (NL-OBJ).
---
It appears to me that the SPX is trying hard to replicate the mirror image of what it did before the March 2009 low (HEAD). It appears we're at about the point p1 on the graph above. The Early-October - Early-January 2009 consolidation took about three months to complete so I wouldn't be surprised to see the SPX do the same thing now a bit abbreviated in amplitude and time which is common on the right side of symmetrical moves. This consolidation should be pretty frustrating for most.
---
I wouldn't be surprised to see both NL?'s eventually overcome, confirming other HSB's implying even higher moves in the SPX.
---
For now I'm going to give this position some room to operate and so I currently have no stop level where I'll panic out of this position.

Wednesday, May 13, 2009

Almost down to the 875 retest.

A Head-and-Shoulders Top (HST) has formed in the intraday chart that implies a drop to O1 at 865. The neckline (NL) of the Head-and-shoulders Bottom (HSB) in the daily chart, that I've been expected the SPX to retest is at 875. We also have an unfilled gap just above G3. Some buying should come in just under 880 from those trying to accumulate as they expect G3 to fill and they want to be sure to position long so they put orders in just above G3.
---
I expect the SPX to drop to 880 possibly in some late selling into today's close. But I don't think there is much downside left. Therefore, I'll go 100% long at today's close with my accounts not controlled by mechanical methods as long as the SPX is still below 895 at my cutoff time.
---
We have two unfilled gaps overhead which I think will soon fill as the SPX moves substantially higher.
As you can see in the chart above, we're very close to the retest of NL. There may be more downside but today's close could be the lowest in this retest move. The line that I've wanted to buy at for the last month is S1 above which is at about 855 today. We still may test S1 in the future but I think S1 is about the lower limit on any downside in this current move.

Tuesday, May 12, 2009

Channel Failure

The SPX fell out of the ST-S1/ST-R1 channel today which implies a drop of the channel's width down to O2. The late day strength we're seeing now appears to be a perfect retest of ST-S1. In my opinion, the channel failure makes it more likely that we'll soon see a retest of NL and a fill of the 05/04/09 opening gap. I'm still waiting for that retest before I enter long positions with my accounts not controlled by mechanical methods.

Monday, May 11, 2009

Gap open down Today.

The SPX gapped down today and almost filled the G2 gap but plenty of buyers at the gap stopped the drop quickly. The SPX has been trending up slightly ever since. This uptrend has set up a support line parallel but above ST-S1. This and the recent action with the SPX near to, and slightly above ST-R1 at the channels high boundary indicates that the SPX is having trouble getting anything really going on the downside. This is what one would expect in a market that should move much higher.
---
The SPX couldn't meet my buy criteria on Thursday so I'm still looking for a good entry point for my capital not managed by mechanical methods. I am still "hopeful" for a break down and out of the ST-S1/ST-R1 channel, which would imply a then a drop down to retest the Head-and-Shoulders Bottom (HSB) neckline NL and fill G3. I say "hopeful" because I don't have anything that leads me to believe that this is likely except that NL retests often happen and that gaps usually fill. When I'm 50/50 on something, I'll always err on the conservative side. So I'll be waiting patiently.

Thursday, May 7, 2009

SPX Correcting.

As I expected the SPX is now trying to correct back down to close the gap G1 and retest the break above NL that confirmed the Head-and-Shoulders Bottom (HSB) pattern.
---
There are also two small Head-and-Shoulders Top (HST) patterns that imply moves to OBJ1 and OBJ2.
---
The real question is whether the upsloping channel ST-S1/ST-R1 is going to hold. If it fails, the implication is right down to NL at 875.
---
I'm out of time. So for now, I will gamble on the channel holding and will go 100% long with capital not managed by mechanical methods if the SPX is between OBJ2 and ST-S1 at my fund cutoff time.

Wednesday, May 6, 2009

SPX Strong and should move higher.

The SPX is strong and is having trouble correcting much at all. Still waiting to buy a dip and will go 100% long with non-mechanical capital at the next close near ST-S1, which today is anything under 890 at my fund cutoff time.

Tuesday, May 5, 2009

Retesting.

The SPX convincingly broke out at yesterday's open above NL? which is the Neckline of a large Head-and-shoulders Bottom (HSB) pattern. As you can see above there were three attempts are breaking NL? on 04/29/09, 04/30/09, and 05/01/09. The 05/01/09 close actually did close above NL? but it wasn't significant enough to be considered a break.
---
On yesterday's open the SPX gapped up through NL?. The SPX even finished strong breaking above ST-R1. However, breaks out of upsloping channels don't really mean anything. The SPX has now settled back into the ST-R1/ST-S1 channel.
---
We have two reasons why the SPX should now drop for a few days. Many times after the explosive breakout move occurs, the SPX will move back lower to retest whatever it broke above, which in this case is NL?. We also have an unfilled gap from 879-877.
---
Unfortunately, in order to fill the gap or retest NL?, ST-S1 will have to fail. ST-S1 is at 883 at today's close and higher tommorrow. If ST-S1 were to fail, we'd expect a drop of 30 points but that would take the SPX below NL?.
---
So, I'm just going to watch how the SPX reacts around these levels and will not be entering long today.

Monday, May 4, 2009

Breakout.

Head-and-Shoulders Bottom (HSB) confirmed. I'll wait for a retest of NL? to enter long with my accounts not managed by mechanical methods.

Thursday, April 30, 2009

Looks line another failed attempt at breaking NL?

The SPX gapped above NL? and traded above it for much of the day but has now fallen back below. The SPX has also formed a small Head-and-Shoulder Top (HST) today that was confirmed by dropping below the neckline ST-NL. This HST implies a drop to 855 which would also fill the G1 gap. But by doing that the ST-S2/ST-R2 channel would fail implying a further drop to 835 which is on ST-S1.
---
HST's can easily fail in the 10-day chart and the day isn't over yet. But considering the power of the sellers to push the SPX below NL?, I'll pass on taking any action today even if the SPX manages to close above NL? at 875.

Wednesday, April 29, 2009

SPX at Important Resistance. Can it break out?

There's a lot going on in this 10-day SPX graph. I'll start with the most recent and move backwards in time.
---
Right now at 9:31 am Mountain, the SPX is at 874.59 which is literally right on NL? but hasn't clearly broken out above NL? yet. If the SPX bounces off NL? the rest of today, that will make for a difficult decision at my fund cutoff time. The market tends to make life hard for participants so I usually assume such. The hardest thing for me would be that the SPX is right at 875 fifteen minutes before the close as it could easily rally those last 15 minutes and and clearly take out NL?
---
As I've become very conservative in my old age, I'll almost certainly choose to not gamble and just wait it out. I'd much rather be forced to buy at higher levels as opposed to buying a top. If that plan changes, I'll write again today before 1:35pm Mountain.
---
Today's early rally was both news and pattern based. Today's open blasted through the top of a Symmetrical Triangle pattern bound by ST-S2 and ST-R3. The upside implication of this confirmed pattern is the width of the Triangle at the breakout. That level is labeled "sym-tri obj" which was attained early today.
---
One concern I have is that we gapped up this morning on the open (G1). Gaps in the indexes usually fill, but not always. In order for the SPX to fill G1 it's going to have to drop back down to below ST-S2. In the chart above, I've labeled five other gaps which have all filled (a couple more were filled immediately and aren't labeled). EG. An important gap, G5 was filled in a rally near the close last Friday up to ST-R2.
---
Noise in the charts. There are two issues that defeat most beginning technical analysts. First is an unrealistic expectation. Nothing in this business is more than 75% accurate. Expecting otherwise is certain failure. The second is related and what I call "noise", which is simply imperfections in the patterns. There are lots of noise examples in this chart. There are two recent Head-and-shoulders patterns with necklines, nl-y and nl-z. The neckline nl-y is from a Head-and-shoulder Bottom (HSB) pattern. There was a clear breakout to the upside of nl-y late in the day yesterday which implied a move to obj-y. But the SPX was turned lower by ST-R3 and collapsed down to ST-S2 into the close, which is exactly what one would expect. That collapse caused the SPX to drop back below nl-y. Technically, that failure of nl-y renders the pattern unreliable and a failure. But as you can see the SPX did make obj-y this morning aided by some news and the Symmetrical Triangle breakout. A similar thing happened with a Head-and-Shoulders Top (HST) with neckline nl-z. This HST did fail to drop to its implication obj-z because it ran into support ST-S2.
---
Another example of "noise" is one of the points on ST-ST labeled "noise". As you can see, I've drawn ST-S2 as a "best-fit" across the four points on the line which is my policy in the case of minor noise. Of course, at some point a line loses importance when lows/highs don't occur on the line. But as I've said before, lines with parallel counterparts (ST-R2 in this case) are more important that lines without. Thus, more "noise" is acceptable.
---
My main point in all this rambling is simply to say technical analysis is an art not a science. All the patterns on the chart should be considered together (as in the HSB-nl-y/ST-R3/ST-S2 example). They should also be considered in the context of the longer term picture. Most importantly considered with realistic expectations. Chart patterns are just clues about the participants greed/fear based actions that the market is giving the analyst. Sometimes the market is generous with those clues and is well-behaved, other times not so much.
---
The entire ten days in the chart above make up the Right Shoulder (RS?) of the large Head-and-shoulders Bottom (HSB) pattern in the daily chart that I discussed yesterday.
---
ST-S2 and ST-R2 form a rising channel. An upside breakout of a channel this steep is difficult, unlikely, and would usually imply an unsustainable "blow-off" type move that isn't important other than the fact that it's unsustainable implies a correction would be due.
---
If the channel were to fail to the downside, the expected implication of that pattern would be to expect a drop of the channel's width. That would take the SPX down to ST-S1, which is still where I want to buy long into this market. In fact, in order for G1 to fill, the SPX must take out ST-S2. So if NL? is successful at pushing the SPX down again, then "fill G1" vs. ST-S2 will likely be the next battle fought in the SPX.

Tuesday, April 28, 2009

Still Moving Sideways

As I expected the SPX has been moving sideways now for a few days. A failed attempt at breaking above NL? was made near Friday's close.
---
The obvious question I have is whether the drop on 4/21/09 was sufficient to form a right shoulder (RS?) in a forming Head-and-shoulders Bottom (HSB) pattern. Looking at the chart above, I'd have to opine, yes. RS? looks similar to LS? only a little smaller. Edwards and Magee are clear in stating that right shoulder formation is often abbreviated and that fact does not diminish the power of the pattern. So in my opinion, all we now need is a break above NL? to confirm the HSB. The standard measuring implications of a HSB is a move up equal the height of the pattern. That would take the SPX up 210 points above NL? to around 1085.
---
I'm still hoping to enter long at ST-S1 which doesn't look likely today but you never know. I will go long today with capital not managed by mechanical methods, if the SPX is below 835 at my fund cutoff time.

Friday, April 24, 2009

Interesting action today, still being patient.

The SPX opened today by gapping up and through the top boundary of a Symmetrical Triangle (ST) bound by ST-S2 and ST-R2. That breakout would imply a move up of the width of the ST at the breakout point, which is to about 875.
---
Unfortunately, on the way up, the SPX ran into significant selling right at the level of the bottom of the 04/20/09 downside gap (DG420). The fact that the SPX couldn't fill DG420 nor make the ST implication, implies there are some sellers looking to exit at logical places (DG420).
---
Since pulling the graph above the SPX has again moved up to test DG420 setting up support ST-S3, which is the typical post explosive move support that usually sets up.
---
Below at UG424 is today's opening gap which should tend to pull the SPX back down but should also provide support as buyers should show up at that level.
---
So today's battle is probably going to be fought between the gaps DG420 on the upside and UG424 on the downside. All of that action is just more of the sideways consolidation that I expected and doesn't mean much to me until the SPX moves down to ST-S1 which is barely visible on the graph.
---
Since I pulled the graph above, the SPX has fallen off the table and is now nearing UG424. We should get a bump up off UG424. If UG424 fails to support the SPX, today's opening gap should fill and the SPX should move a little lower to retest ST-R2. If we close out the day at that level and at a loss for the day, that would set a possible opening drop to ST-S1 on Monday. In any case, my buying plan from yesterday remains intact until I cancel it.

Thursday, April 23, 2009

Still Waiting.

I still believe that the SPX is going to move sideways for ~10 days as it replicates the action in C1. This sideways move should be bound by NL? and ST-S1. If the SPX can tag ST-S1, I think a sufficient right shoulder will have formed to argue that a Head-and-shoulders Bottom (HSB) pattern will be confirmed with a break above NL?. This is the scenario that I'm currently operating under and therefore I'm looking to go 100% long with my accounts not managed by mechanical methods.
---
Until canceled in this blog, my plan is to take that long position at the next close if the SPX is above ST-S1 and below 830 at my fund cutoff time. That does not look like it's going to occur today.

Monday, April 20, 2009

False Breakout but it's not over yet.

Friday's close was obviously above R1 (chart below) which did constitute a breakout above R1. However, that break was obviously false. I don't think the false break really means anything other than the SPX just wasn't ready to move higher yet.
Symmetry
Off the bottom, we assumed the run up would by symmetrical to the previous drop. That scenario fell apart on 03/18/09 when the SPX moved higher instead of correcting. Now that the SPX topped out at exactly the same level as 02/09/09, I think symmetry may take over again replicating the days between 01/15/09 and 02/12/09, which indicates that we're due for 10-20 days of sideways consolidation.
ST-S1
ST-S1, currently at 815 should support the SPX as it consolidates.
Possible Head-and-Shoulders Bottom (HSB)
If the SPX does test ST-S1 and consolidate for ten days or so it would form the Right Shoulder (RS?) of a HSB pattern. The HSB would be confirmed with a break above NL? at 875 and would imply a further move upward for the SPX of 200 points.
My Plan
I'm still looking to position long near ST-S1 with accounts not managed by mechanical methods. I plan to go 100% long if at my fund cutoff time the SPX is above ST-S1 but below 820. That doesn't look like it will happen today so that plan will remain in effect until I change it in this blog.

Friday, April 17, 2009

Trading above R1 again today.

Just like yesterday, the SPX is (at 1:21pm Mountain) clearly trading above R1. But just like yesterday there will be no way to know at my fund cutoff time whether the close will end up being a clear break above R1.
---
Therefore, I won't be making any moves today with my accounts not managed by mechanical methods.
---
I still think the eventual break will occur to the upside but I'm not confident enough to take any positions until it actually occurs. I'm most likely going to be forced to buy on the first significant pullback after the break.

Thursday, April 16, 2009

Trading above R1

At 1:25pm (Mountain), the SPX at 869 appears to be trading above R1. In my opinion, a close above 872 or so will be a pretty clear break of R1. Since we're so close, it's going to be impossible to know at my fund cutoff time whether the close today will be a breakout and therefore I will not assume so and will not take a long position today. Selling could still easily come in near the close and take the SPX clearly back below R1.

Tuesday, April 14, 2009

SPX rejected at R1 once...

The SPX gapped open down today,
then made a failed attempt to rally back up and fill that gap. Considering yesterday's post-close Goldman Sachs profit news, this is disappointing "sell the news" type action. The downside in the last hour has broken pretty well-defined horizontal support ST-S1, which implies a drop down of the height of the pattern above ST-S1. This implication takes the SPX down to 830.
There is minor support below off ST-S2 and the 4/9 opening gap,
ST-S2 is around 833 at today's close. (Because of the holiday, we have to back up a day when analyzing the SPX action around this line). The top of the 4/9 gap is at 830.
Now that R1 has obviously pushed the SPX down,
I expect the SPX to drop to around 830-835. Then considering that level will have fulfilled the implications of the ST-S1 break, and considering the bullish 4/15 bias (below), I expect another run up to R1 tomorrow. I'm going to take that bet in hopes that I'll get lucky and end up on the right side of a news-based R1 break.
---
If the SPX is in the 830-835 area at my fund trading cutoff, I'll go 100% long with tax-deferred/free accounts not managed by mechanical systems. If these positions are taken, at this point I only plan to hold them one day.
---
I'll also be buying calls today in speculative taxable accounts if we reach that level intraday which I'll plan to sell at R1 intraday tomorrow. (Again, option trading is beyond the scope of what I can do in this report so don't count on any complete or detailed account of when/if these positions are taken or closed.)
April 15th has a huge upward bias.
Just like one would have expected the post-close Goldman Sachs profit report to be bullish for the market, one would expect tax day would be historically bearish. Not true...
---
Historically, 1942-1989 the SPX:
63% winners
44% annualized return
---
Historically, 1990-present:
63% winners
336% annualized return
---
Historically, 2000-present:
89% winners
1514% annualized return
---
Interestingly, 4/16 has been very bullish from 1990-present (similar numbers to above) but was historically flat from 1942-1989.
---
(Tested via ULTRA's Period System.)

Monday, April 13, 2009

Testing Resistance R1

The SPX is testing the important downtrending resistance line R1 (chart below) right now as we near the close. On a shorter term basis a line of support has formed ST-S1. If R1 turns the SPX lower here, an uptrending channel will form with the upper bound being ST-R1. I do believe that the SPX will eventually break out above R1 but I will not be buying today in any case as I'd rather be patient, wait for the break and buy the first signficant pull-back.

Friday, April 10, 2009

Missed opportunity...

As I said in a previous report,
I try to keep my discretionary trading/investment decisions separated from my mechanical systems. I do this to achieve true diversity of strategy. As most of you know I've spent almost 20 years researching/testing and using mechanical investment systems. I follow those systems mechanically for the majority of my capital available to invest in liquid markets. Following those mechanical strategies is a simple matter of running my software which only takes seconds, analyzing my existing positions and possibly making a couple phone calls to get in line with what my strategies recommend. I do not overrule the mechanical buy/sell signals based on gut-feel or the technical analysis that I discuss in this space. I am also very slow to give up on a system. Quitting a system (or advisor) when it is doing poorly is almost a guaranteed loser. Due to human nature, the moment that you decide to quit is usually the point where the market or system is likely to turn. As long as a system is performing within realistic expected guidelines based on its history, I will allow it to recover. Usually when I do "retire" a system it will be because I'm as certain as I can be that the system is not suited for what I see as the likely market future in the intermediate-long term.
The year 2000 is a perfect example.
It became very obvious to me that the unsustainable gains from 1995-2000 had lost momentum and the market was far overdue to a regression back to a sustainable appreciation rate. I had just completed some consulting work for a large money manager who strongly had the same opinion. That work was to create for them a very conservative model as well as a hedging strategy. Since many of my clients are far smarter and more connected than me, and based on my own personal opinion, I abandoned all aggressive strategies and went extremely conservative. It was a very good move. And quite frankly I have not returned to an aggressive mode since then. My entire line of research with ULTRA 10 was designed to be very conservative and that again paid off big for me in the recent bear market.
All of that is too say,
I should paid closer attention this week to a strong seasonal bias. I was itching to go long and while hindsight is 20/20, I think this would have pushed me into that position for my discretionary accounts.
Easter Seasonal Bias (better late than never)
As tested by ULTRA's HDAY system, the last trading day before Easter has a huge upward bias. Since 1942 being invested in the SPX on the day before Easter has resulted in 62% winners with only one loss of 1% or more in 68 years (1997). On the day before Easter, the SPX historically appreciates at a 97% annual rate (over ten times the normal appreciation rate of the SPX). That is a bias that should have never been ignored in this space especially since I was looking for a reason to go long. (It's only money...) What threw me was that many of my strategies contain the bias that goes long for the three days prior to Easter (the default HDAY parameters in ULTRA), which since 1942 has resulted in 69% winners and an appreciation rate of 60%, which is tremendous for a 3-day stretch. So I did largely participate in yesterday's gains but that doesn't mean anything in the context of this report and therefore I apologize. Strong seasonal biases belong in this report and will be in the future. It's easy to make mistakes in this business... The day after Easter has a big bearish bias. Only 41% winners with a historic appreciation rate of -31%, which is about as negative a bearish bias can get. But it's only a one day bias as the next day historically appreciates at a 70% annual rate.
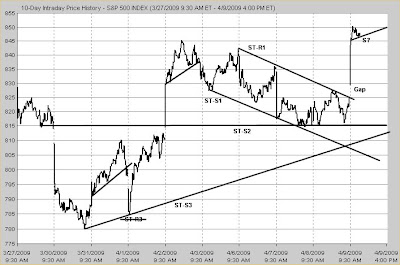
Since we closed yesterday at R1 (chart below),
it makes sense that we'll at least get a one-day pull back as those who are disappointed that the break didn't occur on the close take profits, hedge, and take speculative shorts. But that is in the absence of surprise news this holiday weekend. Again, if I were working for President Obama, I'd encourage him to put something out this weekend that would be a huge positive surprise to the markets so to be rid of R1 once and for all.
President Obama has stated he doesn't follow the markets,
which he proved to me in a 3/24/09 press conference where he stated that the US dollar was "extraordinarily strong", which I found to be a rather odd statement. On that day the U.S. Dollar Index (USDX) closed at 85.82 definitely above its 03/17/08 low of 70.93 but still far below the 07/09/01 high of 120.11. In any case, I generally agree with the President that policy should not be designed to please markets. But in our current situation, it appears to me that making sure there is not another market leg down is of paramount importance.
One of the problems I have with yesterday's Wells Fargo profit report,
is that bank profits were never the main problem. The problem for banks was not on their income statements but rather on their balance sheets due to declining (and/or not appraiseable) asset values that act as collateral for their assets (such as loans they've made). When a relatively stable bank like Wells Fargo has basically an unlimited amount of free money to loan, how could they not make big profits?
The long-term stability of our banking system,
depends on asset values (like real estate) stabilizing in value. One of the important factors needed to stabilize real estate is a recovery of our population's perceived wealth (IE. 401k values), and an improvement in their outlook for the future. Daily news of a consistently rising stock market can do wonders for the attitudes of our people even if they are not significant investors.
With all the blame being thrown around,
by and to politicians and businessmen, the fact remains that if the real estate market had not crashed, this financial crisis would not have occurred. Of course, real estate markets were rising at an unsustainable rate. But in a perfect world they would have slowly regressed back to a sustainable appreciation rate by moving sideways or slightly down until the markets normalized. This would have allowed banks to handle the number of foreclosures within their normal processes. It would have also resolved the problem we have now with the inability to produce reliable appraisals due to the lack of comparable properties. Historical comparable sales mean nothing in a collapsing market.
Except in scarce markets,
or in cases where value is added to a property, most real estate properties historically rise at the rate of consumer inflation (IE. no "real" increase in value). That is the healthy rate of appreciation and still allows for property owners to make plenty of profit. For most properties, profit (equity) is produced for the owner due to the leverage provided by the mortgage.
A simplified example:
A $100k property that rises 5% in a year (to $105k) while consumer prices have risen 5%, hasn't gained any real value. But if the owner has only put $20k down and borrowed the rest, he gets 5-to-1 leverage which produces his profit. In this case, the property rises to $105k. His investment is now $21k (considering the 5% inflation). So his profit is (105k-100k) / 21k = +24%.
Unfortunately, the same leverage also works in reverse.
Assume the same property but with 0% inflation and a 10% drop in value. The owner's loss is (90k-100k)/20k = -50%. For many owners, this loss can essentially wipe them out and motivate them to give up and walk away from the property which puts it on the market eventually by the lender in a fire sale, which depresses values in that market further.
I wrote all of that to state one simple thing.
In order for there to be a recovery both in markets and the economy, the collapse in real estate values must end now. Every thing else is extremely minor in comparison. If our country's real estate market takes another 20% hit from here, all the banking balance sheet problems will return and be far worse than the last round. Real estate appreciation rates must return to be similar to that of a reasonable rate of consumer inflation. In my opinion that is where most of our federal policy should have been targeted. Hopefully, natural tendencies will prevail and it will occur regardless of policy. But in my opinion, right now, Easter weekend 2009 is a great opportunity to help that occur by issuing some timely policy announcement that is friendly to banks, real estate, and therefore the stock market so that R1 is obviously taken out for good.
Enough rambling for today. Have a great weekend!
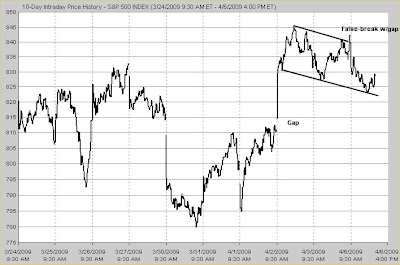
Thursday, April 9, 2009

SPX Nearing Primary Resistance

The SPX gapped open big this morning,
on a positive earnings report from the bank Wells Fargo. As you can see in the chart above the SPX is now very close to the primary resistance R1 that forms the upper boundary of the the channel that is controlling the intermediate-term of this market. Hopefully I'm not allowing my greed emotions to take over a bit, but I now believe the most likely break out of this channel is to the upside (65/35 odds) in the near future. I do have solid technical reasons for this belief which I'll detail in another report very soon.
I do not think the break will occur today,
as the explosive upside is probably over for today. Today, the SPX should continue to trend upward at a more sustainable rate into the close as I've indicated with S? in the chart below. I've drawn this potential support at less of an angle than the previous two similar lines in the recent past (also on the chart below). There's no way to know exactly what this angle will end up actually being, or even if it will develop. But it's just a potential scenario I'll be following for today. (Note: as of 10:05a Mountain, S? has already failed...). There is a chance that huge buying volume could come in right at the close as big players decide that the break is going to happen at tomorrow's open, and/or funds are being bombarded with investments chasing today's strength which they be forced to invest near the close. This is what appeared to be what happened this morning on a shorter term scale as I'll describe below.
If the SPX breaks above R1,
I think we'll make a run at R2. I recently had a client state that he "wasn't too impressed by R2" being only a two-point line with both points being over six months old. It's a valid opinion and Edwards and Magee would certainly agree with that opinion. However, I believe that Edwards and Magee's (E&M) general criteria is too strict for today's market and especially indexes as opposed to individual stocks. There's an unlimited number of stocks so it's easy to find some tracing out valid patterns per E&M criteria. But there's not many stock "markets" that aren't highly correlated with each other. If one waited for true E&M criteria in the indexes, they wouldn't end up with much to go on. It's my theory that back in the 1940's E&M brilliantly captured a phenomenon of human nature, but today there is also a self-fulfillment component involved. I also believe that "for me", trading and investing requires me to try and imagine future scenarios based on all the technical information I have available. I use those scenarios as my guide for discretionary decisions. They certainly are not even close to perfect but it's all I have available in order to retain strategy diversity from my mechanical systems, which I follow mechanically to manage the majority of my liquid investment capital.
Back to R2.
One of the reasons I consider R2 very important is that it has a parallel counterpart S2, which is a four point line, that forms a channel. When that channel failed, the early Oct2008 collapse of the SPX was launched. Important old lines do degrade in importance over time but as long as they show up on the one-year chart, in my opinion, they remain important.
If the SPX made R2,
we'd have in place the kind of bullishness that I'd expect at the top of a bear market rally of historical significance. The kind of bear rally that would completely fake out almost everybody. I'm not saying that is likely to occur. What I am saying is that even if the SPX makes R2, that does not mean our current financial problems are over. We could still drop back down to test the March2009 market lows and then the R2/S1 channel would take over as the major influence in a continued long-term downtrend, which is the secular bear market/Great Depression case. If that case actually develops, I would not be surprised to see the final capitulation being a drop out of the R2/S1 channel straight down to the 400-450 level as I've discussed in the past. Again, I'm not saying this is likely but just laying out a possibility.

Back to Current Reality.

At yesterday's close we rallied all the way back up to ST-R1. Whether that was based on funds forced to take positions or something more sinister such as news leaks about Wells Fargo or simply some collusion among major players, I do not know. But if anybody had any doubt about the importance of ST-R1, that doubt should be gone considering today's opening action. Sure, the opinion that today's opening move was based on the Wells Fargo news is valid and the opinion that the gap over ST-R1 is coincidence is possible. But this stuff repeats so often. Once you start watching it closely, as I've done now for 20 years, I think the "coincidence" opinion is just plain ignorant. (Sorry to be so blunt...)

My plan

As I said, I'm looking to go long. I think today's opening gap will fill before R1 is overtaken to the upside. It appears to me that ST-S3 is still the logical place for which to hope for a good buying opportunity. There should be buyers at the top of the gap, around 828-830 which should provide a bounce. But I will wait for another test of ST-S3. Since ST-S3 is upsloping that test may happen at 828-830 depending on how long it takes for the SPX to drop back to that level.

If I'm Wrong,

and the SPX breaks out above R1 before testing ST-S3 it will likely be a very dramatic move based on news. This move will almost certainly start with an opening gap which will make it likely that the SPX will drop back down to R1 in a retest at which point I'll enter my long positions.

Once I take my Positions,

there's a good chance that I'll be moving to more of an intermediate-term approach and give these positions some room to oscillate in hopes of getting most of the move up to R2. But I'll certainly switch back to more of a trading mode in early September, if not earlier due to seasonality.

This switch in trading term,

will not effect my writing in this space. I've committed to writing multiple times each week here and I'll be expanding my coverage significantly as well. I hope to continue writing almost daily forever as I really enjoy it. And I think I've figured out how to keep my time overhead low enough so that writing here will remain feasible.

Wednesday, April 8, 2009

Yeah, forget about all that...

ST-R1 held and pushed the SPX down significantly
So I'm back to the scenario of trying to enter long near ST-S3 which is right at 800 at today's close. Therefore, with my end-of-day accounts not managed by mechanical methods, I'll go 100% long today if the SPX is between 800-805 at my trading cutoff time.
It's unlikely,
as we've now bounced nicely (at 1:30p Mountain) a bit above ST-S2 (chart below) which indicates ST-S2 is being watched closely. The battle appears to be shaping up between ST-S2 and ST-R1.
I need an acronym...
"End-of-day accounts not managed by mechanical methods", I need an acronym for that. It's actually worse than that even. These accounts are also tax-deferred/tax-free. So, EOD-DT-TF for "End of day - Discretionary Trading-Tax Free" and I'll hyperlink it to a definition when I have more time.

SPX Threatening Short-Term Breakout

Sellers could not push the SPX down to ST-S3.
The buyers put up horizontal support at ST-S2 which has a pretty well defined horizontal counterpart (ST-R2). On ST-R2 is a bottom and three tops which to me makes it significant on a short-term basis. ST-S2 and ST-R2 form a small horizontal channel of which the SPX has now broken out. This breakout implies a move up of the channel width to SPX 835 which would fill yesterday's opening gap at which point there should be quite a bit of selling.
An SPX move to 835 also takes out ST-R1.
I've redrawn ST-S1 as the old line became ragged and noisy. Again, this is very common on intraday charts and doesn't bother me much.
So if we assume ST-R1 will fail,
and that it's still the upper boundary of a valid channel, the break would imply a move to 845 which is the 4/2/09 top.
I think this scenario is likely,
and I think some symmetry will come into play with the SPX producing a mirror image of what's to the left of the 'R' and '2' in ST-R2 in the above chart. Symmetry implies the SPX will move to 835 and fill one gap. Then the SPX should correct back down to retest ST-R1. Then move higher, to fill the 4/6/09 opening gap. If we can get those moves to occur an Head-and-shoulders bottom would then be confirmed (with neckline NL?) implying a further move to 860 which takes the SPX up to the primary resistance R1 (in charts below).
Whether this scenario is tradeable on an end-of-day basis for me,
depends on how closely my scenario plays out and where in that sequence the close occurs. I won't chase the SPX today based on an ST-R1 break. However, if the SPX were to close yesterday's gap, then drop back to retest ST-R1 and still be near that test at the close, I will take take that trade hoping to get some of an 825-860 move which is around 6.4% in Rydex Nova. It's unlikely that buy setup would occur today but not impossible. I also remain a buyer on a test of ST-S3 especially if we gap down to it, bounce off a bit and close reasonable close to (but above) ST-S3.

Tuesday, April 7, 2009

Remaining patient

Buying came in at the top of the gap at SPX 815
just as I suspected and it looks like we may get another late day rally just like the last two days. I wouldn't be surprised to see the SPX close over 825 for the day. That keeps me on the sidelines with end-of-day accounts not managed by mechancial methods for today. I really want that buy at ST-S3. Maybe I'm being greedy but I think being greedy while in cash in a bear market is wise.
One of the things I believe dooms many investors
is the emotional pain from being left behind by a rising stock market. It's a human nature trait that I try to avoid at all costs. Logically, it doesn't even make sense. Every single day, thousands of "markets" are moving all over the place. Very few care if they missed out on the big move in soybeans. (Not that there was one, I don't follow soybeans). When it comes to trading or investing, "the market" is just a number. It really doesn't matter what that number is. What matters is what that number is going to be in the future. Markets oscillate around their true trend. So as a market goes higher, pressure mounts for it to regress back down to its actual trend. That is why I rarely chase markets and panic buy.

Two opening down gaps in a row.

The SPX opened this morning gap down for the second consecutive day.
We actually broke down below the bottom of the downtrending channel ST-S1, but that move is just noise. Intraday charts are far from perfect in terms of acting technically normal around support/resistance. The fact that the break occurred on the open further indicates its lack of importance. Buyers and sellers line up on both sides before the open. Where that battle ends up is where trading begins, the open. Since that number is largely unknown it makes logical sense that there would be some extra noise there.
Two opening gaps in a row tells me,
that there's a little panic going on as people lock in some profits, put on some hedges and speculative shorts near, but actually still quite a bit below important resistance R1 There was a lot of negative pre-open banking news and of course George Soros stated that the rally is "unsustainable", likely because it's going against Mr. "I'm having a very good crisis".
So after rechecking the chart it appears ST-S1 is being taken out right now (11:12a mountain).
In any case, I think the gap below is going to fill soon. If the channel fails now I'd expect a drop of the channel width which overshoots lower than the gap. We'll probably get a bounce off the level of the gap as there should be buyers there. But I think we'll probably see a test of ST-S3. I'm still looking to go long with end-of-day accounts not managed by mechanical methods but won't make that call until 1:30p (mountain) or so. I'll post here around then in any case.

Monday, April 6, 2009

Nearing the Moment of Truth

Turned Down Temporarily
The SPX ran into some selling further below R1 than I had expected and has dropped back just a bit. It ain't over. I expect a real test of R1 to occur in the near future.
The uptrend line S2
One of the most repeating patterns I've watched over the last 20 years is how off lows in every timeframe, the SPX will start a 'V' bottom, move sharply higher, then correct down a little. Buyers than missed the sharp up move come in so quickly that the SPX resumes its move up. Very often a line drawn off that first low at an angle half as steep (or less) as the initial sharp move becomes the dominant support for the uptrend. (We've quantified historical probabilities for that slope in the past and are currently revisiting/updating that topic.) We first mentioned S2 in it's very early stages of formation and it remains a factor. For now I feel that S2 and R1 are going to determine which way the market turns. Since those lines are converging, the SPX is going to break one or the other soon.
Let me be perfectly honest here.
I've watched, researched, and traded "the market" now for nearly two decades. I diversify my business/investment activities widely but the majority of my research is purely on how to predict markets. Having said that, I really have no idea whether the SPX is going to break out above R1, or fail and move lower. I believe that buyers and sellers are battling right now and the winner of that battle, probably with the injection of some unpredictable and surprising event, will determine whether R1 is overcome or not. Any advisor who states that the market is going much higher from here is stating R1 will be overcome and that is simply a guess. Nobody has a crystal ball.
Since I don't know,
I have two choices. One is to "wait and see" and possibly miss out on what could be a spectacular up day as the break occurs. Frankly, this tends to happen to me quite often because I am generally risk averse and buying near resistance is risky because resistance "should" turn turn the market lower. However in this case, its rare that another buying opportunity doesn't come along on a pullback if I'm patient. My second option is to find another good reason to get long on a shorter-term basis with an exit strategy and possibly luck into being long on the breakout day. This happens for me fairly often as well.

In the intraday chart we had some very interesting action at yesterday's close and today's open. As you can see in the chart above, a well defined downtrending channel had formed. In the closing minutes the SPX broke out of that channel. That implies some really felt like there was going to be an upside surprise today. Unfortunately, that breakout was false and the SPX dropped back today to the bottom of the channel. Today's open also gapped down.

Between two gaps.

So we're now trading between two unfilled gaps which may set up an interesting opportunity. If the channel fails, I'll expect a drop equal to the width of the channel down to around 805. Another possibility is that the SPX just rides the channel down in the next few days, eventually getting down to below 815. In either of those cases, I plan on entering the market long hoping for a pop higher to fill the overhead gap at 840. Entering at 815 and selling at 840 is about a 4.5% profit in Rydex Nova which would be my main goal. My secondary goal would be to luck out and be long as some event based surprise launches the market through R1. With the restrictions that come with end-of-day trading some luck may be required to pull it off within the restrictions I'm under with this space. Honestly, I may have to play this one mostly with options, which is beyond the scope of what I can detail here. (You think trading markets is hard? Try doing it while at the same time telling others your plans in advance...) In any case, with 26 minutes left it's unlikely anything will happen today. But I'll definitely indicate any end-of-day actions I plan to take in the coming days.

Friday, April 3, 2009

SPX Turned Back by Short-Term Resistance

The SPX opened yesterday with a gap and ran to R5 where it was promptly turned back lower. As you can see above, the support line S6 which is drawn off the first significant pull back after the explosive phase of the rally, failed to support the SPX much at all. Interestingly, S6 was failing at the exact time President Obama was heralding the G20 Summit reforms as, "turning point" in the world's quest for recovery. All important turning points start with very minor technical failures. I don't think it's likely but it would not surprise me one bit if the "turning point" actually ends up being the end of this intermediate-term upmove. I'm not saying any thing negative about our President or any of the world leaders, this is just how the market often works. In the short-term, yesterday's opening gap will put pressure on the SPX to drop back down to fill the gap. As the gap opened it jumped through a minor line of resistance (S7) which should now act as support as the SPX comes down. Normally S7 wouldn't even be worth mentioning but any time a market gaps over something it becomes more important. The gap also created a little Island Reversal pattern which is an area of pricing separated on both ends by gaps at similar levels. That pattern implied a move higher equal to the height of the pattern but that happened immediately upon yesterday's open. While interesting, Islands are of minor importance in the SPX chart. In Summary, I think probability has the SPX eventually dropping down to S7 but not quite filling the gap. The failure to fill will be due to lots of buyers in and at the high side of the gap. Those buyers should launch another run up to attempt to break out of the important R1 (in charts below) which is now only about 25 points overhead. A break above R1 would be a very bullish indication and I think the SPX is going to make multiple attempts at a break. It's going to be interesting to watch how the SPX acts as it attempts those breakouts. For now I plan to wait on the sidelines and just watch the show.

Tuesday, March 31, 2009

Back to cash.

The SPX did make 809 today which is the bottom yesterday's opening gap. I will follow the sell rule I set yesterday. I'll move all accounts not managed by mechanical methods back to cash at today's close as long as I still have a profit at my fund cutoff time. Much of this capital is invested in Rydex Nova. So as of right now I'm looking at about a 3.5% one day gain. Of course, there's still 53 minutes left and a lot can happen in that time.

Monday, March 30, 2009

Nothing Bearish About Today's SPX Drop yet.

Today we opened with a big downside gap in the SPX due to news over the weekend concerning President Obama and GM/Chrysler. To me, a news-based gap and subsequent drop feels like a bit of mini-panic. Technically speaking, it's just a retest of the break above the R2 downtrend line, which is very common and nothing for the Bulls really be concerned about. The drop should find some support on R2 as old resistance often provides support but there's nothing all that comforting with "support" that's dropping as fast as R2. In other words, the SPX could drop day-after-day riding R2 lower and still be "supported". Additional support, should be provided by S3 at ~765, but its very short-term in nature. S3 is the level of an old top in the prior move down. Old tops often provide support for markets temporarily correcting down in an uptrend. S3 was also confirmed by supporting a drop on 3/20/09. And then there's the gap. That opening gap will tend to pull the SPX back up as long as traders don't completely give up on this rally. We're currently trading at 781 while the bottom of the gap is at 809 which is 3.6% overhead. Lastly, The SPX has an historical upward bias on the last day of each month and the first three trading days of the next month. For the March case, the SPX has shown a gain since 1942 over those four days 60% of the time (slighty more than normal) with the SPX appreciating at an annual rate +2.5 times normal. Since 2002, this bias has been strong with no losers, one break even, and the SPX appreciating at a 106% annual rate. Therefore, I will take this short-term trade with accounts not managed by mechanical accounts. As long as the SPX is between 765-790 at my Rydex cut-off time today, I'll go 100% long and sell at the first day that either today's opening gap partially or fully fills and I have a profit at the close, or at the close on the third trading day of april. However, I may change that sell plan and will make notification in this space.

Thursday, March 26, 2009

The SPX broke out above R2

which I think will launch the SPX to R1 at about 880. That's 5.7% above where we closed today. If the SPX moves straight up to R1, I will miss the ride with my accounts not managed by mechanical methods. I'll assume that the downtrending channel bound by R1/S1 is going to control this market until it doesn't, which means to me that this is still a bear market rally. Therefore, I should err on the side of caution.

Look at the chart above and assume

that I chased the market and bought in at 850 tomorrow. Then imagine R1 turning the market down all the way to S1. Well, that entry at 850 would look awfully foolish in hindsight considering how close it is to R1 in an ongoing bear market. Technical analysis is easy in hindsight so I think considering how hindsight will appear if things don't go as planned is a useful exercise.

What I'd like to see is

the SPX run to 880 (R1) in the next week or so and then about a month of consolidation with the SPX bouncing between R1 and R2. To me that would indicate the sellers just cannot push the market back down to S1. And more points on R1 in either direction make R1 more significant and the channel's influence more likely. S1 is also strengthened simply because it's a parallel counterpart to the well-defined R1. I'd hope to get some directional clues during that consolidation period and position long depending on those clues.

Then I'd like to see the SPX

blast above R1 to about 950, then correct back to R1 in a retest and very obvious buying opportunity at about 850. If that were all to occur, I'd expect the SPX to run to over 1100, which is a move similar to the width of the R1/S1 channel. This move could still just be a bear market rally but as the market moves higher, long-term investor opinion shifts to bull market "buy the dips" mode. Then the old highs (~1550) will start pulling the market higher as opinion becomes that "surely" this new bull market will make all-time highs.

Of course scenarios rarely

play out exactly as for what you wish. So as of now, I'm simply willing to miss out on the move to 880 and buy the pull back which could drop as low as 800. If I don't get that, I'll just have to wait for a post R1 breakout retest of R1 up higher. If I don't get that, I'll face what I believe to be the toughest decision that exists in market timing. When do you give up on a pull back and chase the market?

I've faced it many times before,

which reminds me that I need to revisit the historical significance of when indexes move X% above their Y-day moving averages. I believe with today's close the Dow Jones Industrial Average will be about 9% above its 21-day moving average. This is rare historically and implies great strength. Maybe the type of strength worth chasing. But considering recent volatility, measures like this compared to historical norms may also be temporarily meaningless. Or maybe I can get something interesting to reveal if I normalize with the VIX. Just thinking out loud... I will do some testing, form an opinion, and report back.